Showing posts with label digital mathematics. Show all posts

Wednesday, November 2, 2011

A strange analysis

A strange thought recently came to my mind - to represent different cycles of different scales (small scale cycles within medium scale cycles, which are again within large scale cycles) in such a way that all the results are positive (individual and cumulative).

I think there are endless ways to do this - however I tried to do it mathematically. I tried write a single mathematical function and managed to compile one using exponential and sine functions

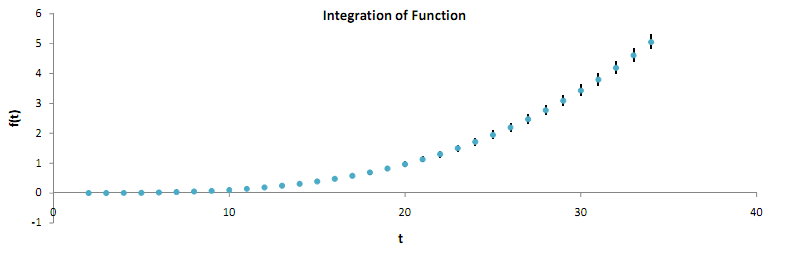
f(t) = [Base1 sin (t*360/A)]*[Base2 sin (t*360/B)]*[Base3 sin (t*360/C)]

The Base controls the amplitude of the cycles while the constant factors control their frequency.

However the single mathematical function did not give the result. But the moving average trend-line revealed the cycles.


Big cycles, medium cycles, small cycles - as I had wanted.

Enough of such strange analysis.


:-)

S


Friday, October 14, 2011

Excel calculus

Definite Integration

b
∫f(t)dt = ∑ [((f(tp) - f(tp-1))/2)*(tp - tp-1)]
a

Here f(t) is the function which is to be integrated.
f(tp) is the value of the function at p-th cell in excel.
The summation is to be performed between a & b cells in excel.

There can be two errors due to assumption of the height of the rectangle as ((f(tp) - f(tp-1))/2) for area calculation. The other alternative heights can be f(tp) or f(tp-1). Error analysis shows that as the number of rectangles (smaller steps) or the number of cells increases, the value of percentage error decreases exponentially.

Example:

Plots of integration and error analysis of the function f(t) = t2


:-)


Saturday, October 8, 2011

Cycles in cycles

Cycles in Cycles


f(t) = [sin (t*180/A)]*[sin (t*180/B)]*[sin (t*180/D)]

where
A=0.18, B=180, C=1800

:-)

Friday, October 7, 2011

My latest artwork

A double periodic function


Function 1: [e^t]* [sin (t*pi/5)]
Light Blue Graph

Function 2: e^t
Dark Blue Graph

Function 3: 3 term moving average trend-line of Function 1
Orange Graph


The fun was with "t".

t = sin a
where a is 0.05, 0.10, 0.15, 0.20 ..............


A non-uniform periodic function


Function 1: [e^t]*[10^t]* [sin (t*pi/10)]
Light Blue Graph

Function 2: [e^t]*[10^t]
Dark Blue Graph

The fun was with "t".

t = Log 10 (a)
where a is 1, 2, 3, 4, ..............


Thanks to Microsoft Excel 2007 for drawing the graph.


:-)